If you only look at rankings, Lynbrook appears almost invincible: a 99.52 U.S. News score, #10 in California, #86 in the nation, 89% AP participation, and a student body where 94% are proficient in math and 95% in reading. But admissions officers don’t admit schools. They admit students. And at places like Lynbrook, where over half the senior class has a 3.75 - 4.0 GPA, the real story is how AOs contextualize your performance inside one of the most academically saturated environments in the country.
Lynbrook’s prestige does not “boost” an application. Instead, the school profile gives admissions officers the data they need to understand what your achievements mean relative to your peers, and whether your story emerges distinctly inside a competitive school group.
Lynbrook students don’t get in because Lynbrook is hard. They get in because they manage to build a compelling narrative within that context.
Lynbrook High School Ranking
According to Niche, Lynbrook earns an A+ overall grade with high marks in Academics, College Prep, and Teachers.
Key recognitions include:
- #26 Best STEM High Schools in California
- #31 Best College Prep Public High Schools in California
- #40 Best Public High Schools in California
US News’s rankings are similarly high:
- #86 Nationally, #10 in California, #1 in Fremont Union High School District
- AP participation rate: 89%
- 94% reading proficiency, 91% math proficiency
These rankings are helpful for getting a sense of where Lynbrook’s academics lie in relation to other schools in the area, but they are not what admissions officers look at.
In admissions, what matters is the school profile, because that document explains rigor, GPA distributions, course limits, and competitive density.
Lynbrook High School Profile (What AOs Actually Read)
High schools put together school profiles that tell admissions officers important context about the school. Below are the elements of Lynbrook’s school profile that materially affect admissions evaluation:
1. GPA Distribution
While Lynbrook doesn’t rank, we do see the unweighted GPA distribution. This is one of the most important contextual metrics:
- 57.07% of seniors have an unweighted 3.75–4.0 GPA
- 75% have 3.5 or higher
In most U.S. high schools, a 3.8 UW puts you in the top ~5%. At Lynbrook, a 3.8 may place you roughly in the middle of the academic distribution. AOs know this.
2. Rigor Constraints
The school profile shows several structural limitations:
- Students are only guaranteed 6 classes per year
- Students are limited to 1 course per subject area per year
- Many students supplement with community college classes
This means a Lynbrook student taking “only” 6 classes with a moderate AP count may still be considered maximally rigorous for the school.
3. AP & Honors Landscape
From the profile:
- 90% of students take at least 1 AP
- 93% AP pass rate
- 446 AP Scholars with Distinction
Lynbrook students on the whole are taking rigorous courses and doing well on the corresponding AP exams.
6. Academic Context
- Average class size: 32.5
- Counselor ratio: 401:1
Together, these metrics show a large public school with high-performing students who may have less 1:1 support than schools with smaller class sizes and lower student-to-counselor ratios.
How Admissions Officers Read Students from Lynbrook
The “School Group” Framework
AOs evaluate Lynbrook applicants relative to each other, not relative to applicants from other regions. The internal process typically looks like:
- Sort by weighted or school-adjusted GPA
Even though Lynbrook reports unweighted, colleges either use the unweighted GPAs and look at rigor, or they recalculate GPAs using their own internal formulas. - Compare rigor within the constraints of the school
Did you take the most demanding load available to you? Did you go out of your way to take on extra community college classes? - Look for year-over-year patterns
Admissions offices have a long memory:- How strong is this year’s top cohort compared to previous years?
- Are students applying to the same majors (CS, engineering, biology)?
- Evaluate your narrative and differentiation
In a school where 400+ students look “excellent on paper,” the personal score—essays, ECs, character—is decisive.
Being from a hyper-competitive high school doesn’t necessarily hurt or help you, but it’s important to understand your achievements in context.
UC Admissions Data for Lynbrook
The University of California actually publishes their admissions information by high school. You can see the whole database here.
Take a look at Lynbrook’s data for admission to UC Berkeley:
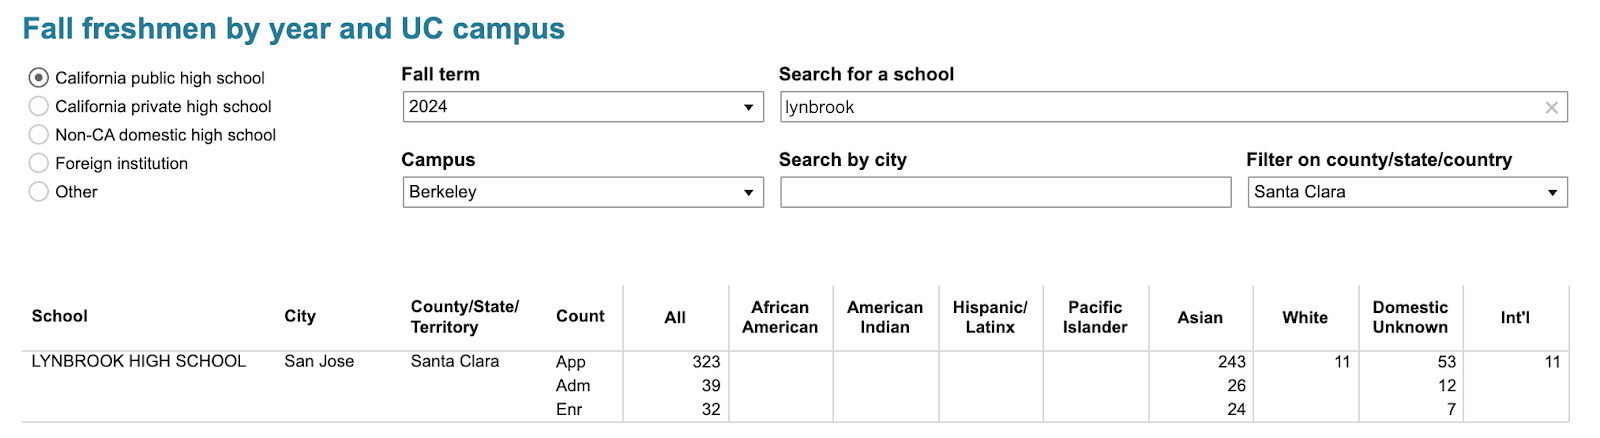
- 323 applied
- 39 admitted
- 32 enrolled
That is roughly a 12% admit rate, despite Lynbrook’s extremely strong academic pool. That’s about the same as Berkeley’s overall admit rate of about 12%. Because these admit rates are roughly the same, we can see that Lynbrook doesn’t necessarily have an extra boost in admission at UC Berkeley.
And because the yield rate is so high (32 enrolled out of the 39 admitted, which is an ~82% yield rate), Cal admissions officers probably aren’t looking to over-admit at Lynbrook to meet their yield goals. To be a competitive applicant at Berkeley, then, you’ll probably want to be around the top 10% of your class.
UC GPA Data for Lynbrook
We can also see the GPA breakdown by UC school:

Average GPAs of admitted Lynbrook students (2024):
- Berkeley: Admit GPA: 4.22
- UCLA: Admit GPA: 4.27
- UCSD: Admit GPA: 4.26
- UC Irvine: Admit GPA: 4.25
- UC Merced: 3.94
The UC calculation includes weighting here, so we can see that admits to top UCs sit above a 4.2 GPA. This means they have perfect or near perfect grades and strong rigor. Even admits to UC Merced, the UC with the highest admit rate, still have a 3.94 average weighted GPA. What you should take from this data is this: the UCs are not a guarantee. Focusing on your course rigor, GPA, and extracurricular accomplishments can help you stand out in UC admissions.
Strategic Takeaways for Lynbrook Families
For Prospective Families: Who Thrives Here?
Students who tend to succeed at Lynbrook are:
- Self-motivated, academically independent learners
- Comfortable being in a rigorous environment
- Students who can carve out “lanes” to craft their own unique story
If a student needs more help or thrives in small ponds, Lynbrook may feel overwhelming.
For Current Lynbrook Students: What Matters in Building a Standout Application
-
Think of your GPA and rigor in context as you plan your future courses and your college list.
-
Distinguish yourself through academics and extracurricular impact.
-
“Soft” factors in the application, like essays and activities, help you stand out at a school like Lynbrook
- Build a smart school list that has a balance of true safeties, targets, and reaches.
Final Thoughts
The prestige of Lynbrook alone does not get students into selective colleges. Your context, choices, and story do.
If you want to understand how your specific profile will read to an admissions officer—and how to build a narrative that rises above one of the most competitive school groups in the state—we’d be happy to talk.